We welcome all to a new week here throughout our properties. Our team selected a hopeful image of our founders' collection as we leave all with a snapshot courtesy the team at the Visual Capitalist as we look forward to the opportunity to serve:
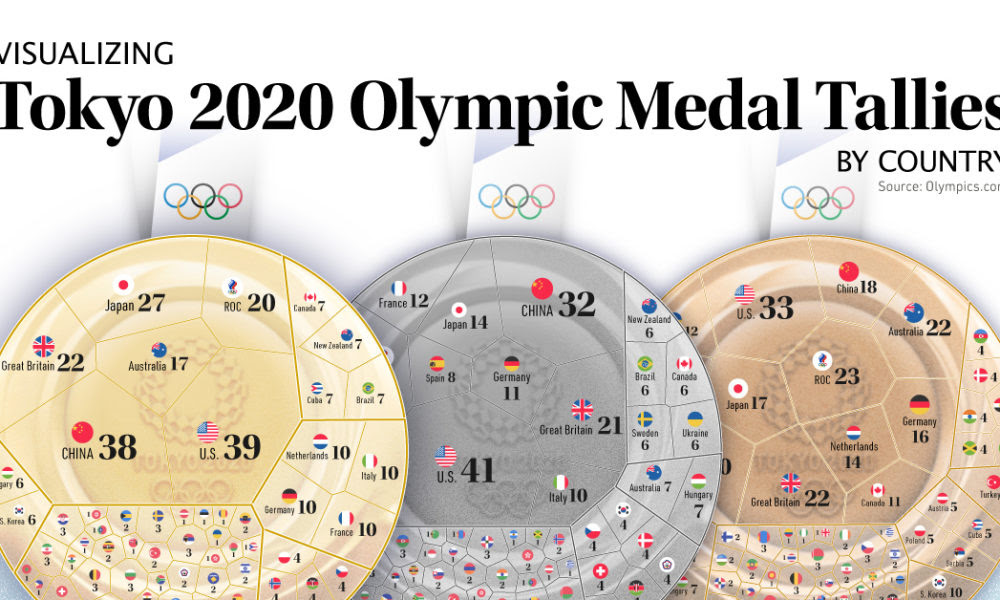
After 17 days and 339 events, Tokyo 2020 has come to an end. Here we visualize the final Olympic medal count for participating countries. |
|
|
The U.S. is the largest oil producer in the world. Here we map the share of U.S. oil production by all 50 states in 2020. |
|
|
The world map you know is totally wrong. Check out this clever graphic, which helps put into perspective the true size of countries. |
|
|
If you've ever bought an item on sale, you've experienced the value factor. We break down factor investing using real life examples. |
|
|
Nearly 60% of the world's population lives in cities and this trend is not slowing down—take a look at the world's 20 fastest growing cities. |
|
|
As more metals are necessary for electrification and clean energy transition, companies are looking at an unexplored market: ocean mining. |
|
|
Some countries prefer trucks over sedans, or local manufacturers over European or Japanese. This map shows the best-selling vehicles in the world. |
|
|


No comments:
Post a Comment