Welcome to the Education Corner, A Daily Outsider Property Working to Help transform our Conversation About Our World: http://ordinaryfaces.business.site
This infographic highlights the accelerating pace of layoffs so far in 2022, as businesses cut costs ahead of a potential recession.
We look at quotes from investing legends like Warren Buffett and Peter Bernstein to take cues on how investors should approach a down market.
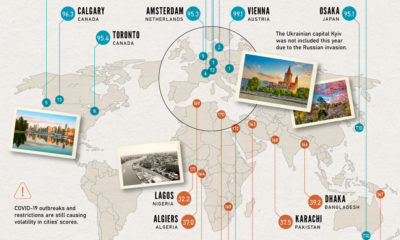
Which cities rank as the best places to live worldwide? This map reveals the world's most and least livable cities.
Global EV sales have grown exponentially, more than doubling in 2021 to 6.8 million units. Here's a look at EV sales by country since 2011.
The U.S. emits about 6 billion metric tons of greenhouse gases a year. Here's how these emissions rank by sector.
Brand loyalty has declined for most luxury automakers, but three brands—Tesla, Maserati, and Genesis—appear to have bucked the trend.
Cyberattacks are becoming more frequent and sophisticated. Here's what investors need to know about the future of cybersecurity.
This graphic shows a timeline of every mission to Mars since 1960, highlighting which ones have been successful and which ones haven't.
Cities are heavy hitters in the global economy. Where will the top 10 cities be in 2035—based on GDP, population, and annual growth?Originally from October 2019


No comments:
Post a Comment